Average Ironman Time
Understanding Average Ironman Times
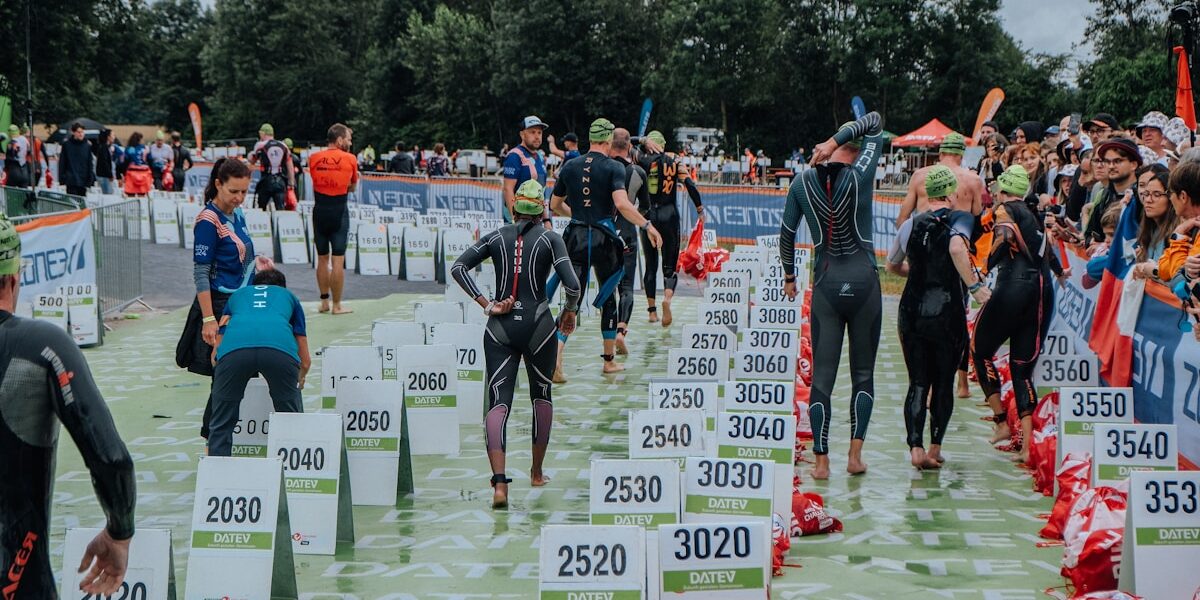
Ironman competitions test the limits of human endurance. These races involve a 2.4-mile swim, a 112-mile bike ride, and a full 26.2-mile marathon run. Finishing an Ironman is an achievement itself, but many athletes also aim to monitor their performance through time metrics.
Factors Influencing Finishing Times
The average time to complete an Ironman can vary widely. Several factors contribute to this variation. Performance can depend on the athlete’s age, gender, experience, and training regimen.
Age
Age plays a significant role in Ironman completion times. Younger athletes often have better physical capabilities. However, endurance can improve with age up to a point before it begins to decline. Athletes in their 30s and early 40s tend to post competitive times.
Gender
Men and women typically have different average completion times. Men often finish faster than women. According to data, men’s average Ironman times are generally about an hour quicker than women’s.
Experience
Experience in triathlons affects performance. Seasoned athletes have fine-tuned strategies for pacing, nutrition, and transitions. Newcomers might need to spend more time and energy navigating through the event.
Training
Rigorous training contributes significantly to finishing times. Athletes who dedicate extensive hours to training tend to perform better. Structured training programs often incorporate swimming, cycling, running, and strength conditioning.
Average Times Across Different Stages
The Ironman race is divided into three main stages: swimming, cycling, and running. Each stage has its own average time benchmarks.
Swimming
The 2.4-mile swim usually takes between one to two hours. Elite swimmers may complete this leg in approximately 50 minutes. Average competitors might take between 1 hour and 20 minutes to 2 hours.
Cycling
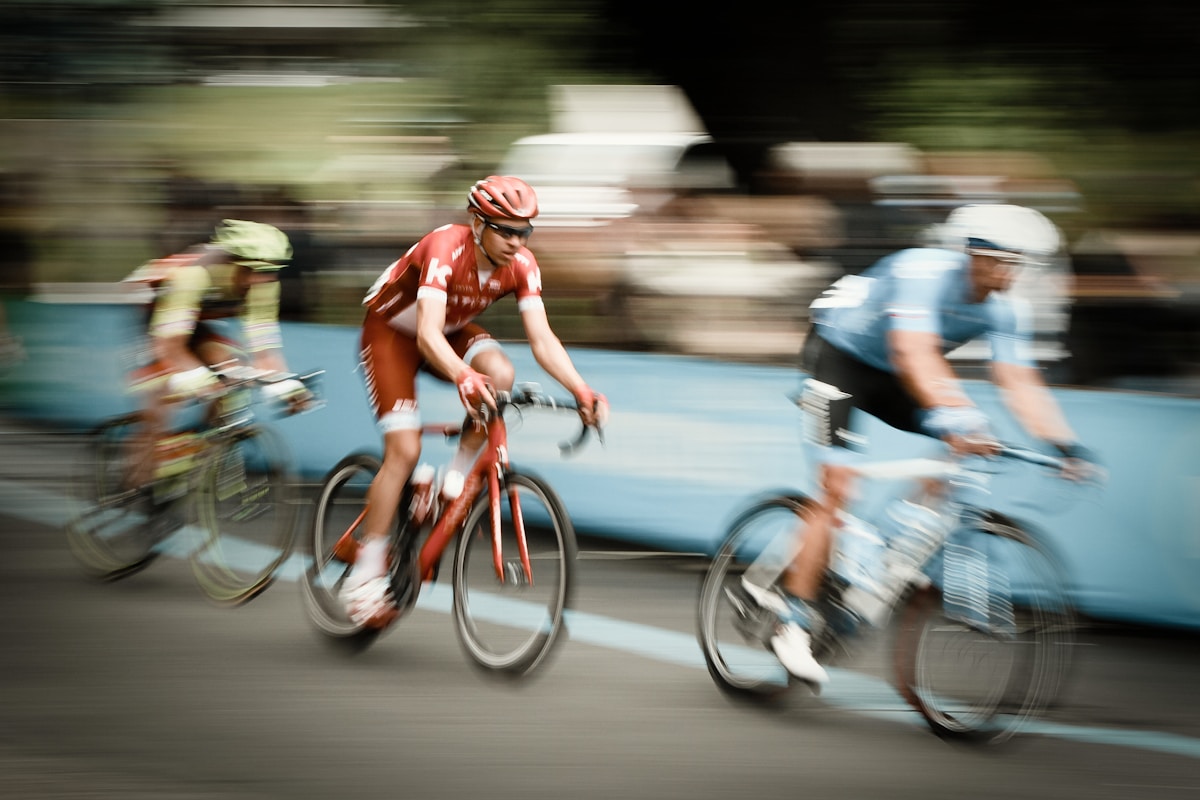
For the 112-mile bike ride, the average time falls between 5 to 7 hours. Professional triathletes often clock in around 4 hours and 30 minutes. Most participants take approximately 6 hours for this stage.
Running
The marathon run, covering 26.2 miles, can range from 3 to 6 hours. Elite runners may finish just over 3 hours, while average triathletes complete it around 4 hours and 30 minutes to 5 hours.
Breakdown of Average Total Times
Combining all stages, the average total Ironman completion time hovers around 12 to 13 hours. Here’s a quick breakdown of aggregate time metrics:
- Swim: 1 hour 20 minutes
- Bike: 6 hours
- Run: 4 hours 30 minutes
Transition times between stages also add up. This may take an additional 10 to 20 minutes overall.
Notable Performance Variations
Individual performance can deviate significantly from average statistics. Some athletes push through the entire course in under 10 hours. Outstanding professionals aim to finish in about 8 hours. Meanwhile, some participants may take up to 17 hours, exhausting the race cutoff time.
Training Tips to Improve Times
A well-rounded training plan can improve your Ironman finishing time. Consider these pointers:
- Consistent Training: Regular workouts help build and maintain endurance.
- Structured Plans: Follow a structured training program tailored to your skill level.
- Nutrition: Focus on proper nutrition before and during the race.
- Recovery: Incorporate recovery days to prevent overtraining.
Many athletes measure their performance against these averages to gauge their training progress. Tracking and analyzing each segment can offer insights for improvement.
Consideration of Course Difficulty
Ironman races are held across various global locations. The terrain and weather conditions can affect average finish times. Hilly courses or extreme climates pose additional challenges. Locations like Kona, Hawaii, known for its heat and crosswinds, often yield longer average times compared to flatter, milder courses.
Environmental Conditions
Weather affects performance. Hot and humid conditions require more hydration and pacing adjustments. Cold or rainy weather can slow down the race pace, especially in the biking and running stages.
Course Layout
Course difficulty also plays a role. Some courses are renowned for their tough topography. Steep climbs during the bike segment or hilly marathon courses can significantly affect times. Athletes might take longer on these tracks compared to flat and fast routes.
Impact of Technological Advancements
Advancements in gear and technology also contribute to improved times. Modern wetsuits, aerodynamic bicycles, and advanced running shoes offer competitive advantages. Training tools and wearable tech provide data-driven insights, helping athletes optimize their training and race strategies.
Aerodynamic Equipment
Triathletes benefit from bicycles designed for minimal air resistance. Helmets, cycling suits, and even hydration systems are engineered to reduce drag. These improvements, collectively, shave off precious minutes from the bike segment.
Wetsuits
Wetsuits have advanced materials and designs that improve buoyancy and reduce water resistance. Athletes can conserve energy and maintain a more streamlined swimming posture. This results in more efficient and faster swim times.
Training and Monitoring Devices
GPS watches, heart rate monitors, and power meters offer real-time data. Athletes can track their pace, distance, and exertion levels meticulously. These tools help in fine-tuning training regimes and making real-time race-day adjustments.
Analyzing Data for Trends
Data analysis reveals trends in Ironman finish times over the years. Analyzing data from various races helps in understanding performance norms and recognizing areas requiring improvement.
A decade ago, average times were generally slower. However, with enhanced training practices and technology, athletes today are seeing improved times. Historical data comparison shows performance improvements, indicating that modern athletes are breaking previous barriers more consistently.
Elite vs. Age Group Performances
Segregating elite athlete times from age-group participants provides additional insights. Elite athletes show a steady trend of times between 8 to 9 hours. Age group finishers have also seen improvements, possibly due to better access to training resources and knowledge.
Conclusion
Average Ironman times provide benchmarks for athletes aiming to understand where they stand in the broader spectrum of the event. Various factors like age, gender, experience, and equipment play crucial roles in these times. Through regular, strategic training and utilizing modern tools and techniques, athletes can aim to improve their personal bests and achieve new milestones in this grueling yet rewarding endurance sport.


Stay in the loop
Get the latest triathlete today updates delivered to your inbox.